

Tracking and Logging Paddle Data
Tracking and logging paddle data may not appeal to many folks, just out to enjoy a day on one of Florida’s beautiful waterways. For others, keeping track of paddle data is part of the enjoyment of the experience. Knowing certain stats and keeping notes about certain trips adds to the adventure, especially when planning future paddles. As an ex topographic surveyor, keeping logs and notes of each paddle is in my blood. That is why I started Florida Paddle Notes…a personal journal of each paddle…to share with others and hopefully help in planning future paddles. Water levels change, seasons change as do the Flora and Fauna, making each trip on our Florida Waterways unique in it’s own way.
This article focuses on how I track my paddle data and then, consolidate certain aspects of that data to cover three areas I like to keep track of, Average Miles per Paddle, Total Cumulative Miles for the Year, and Average Paddle Speed.
Tracking the actual Paddle Data…
![]() There are several apps out there that are used to track paddle data as well as GPS devices. I am not here to promote one over the other. Each are unique, providing for different ways to track your paddle data. At Florida Paddle Notes, paddle data is kept track of using the app Paddle Logger. This app provides me with the tracking data I need and has been proven quite reliable and easy on my iPhone battery.
There are several apps out there that are used to track paddle data as well as GPS devices. I am not here to promote one over the other. Each are unique, providing for different ways to track your paddle data. At Florida Paddle Notes, paddle data is kept track of using the app Paddle Logger. This app provides me with the tracking data I need and has been proven quite reliable and easy on my iPhone battery.
Paddle Logger tracks the numerous categories of data to include a detailed map of the paddle. It allows markers to be added forpoints of interest as well as photos taken. It can be paused during breaks. Here is a list of some of Paddle Loggers features…
- Trip Name – This is editable. Type in the name of your trip
- Date -Recorded on the day of your paddle
- Time – Records the starting time of the paddle
- Duration -The hours, minutes and second of the trip’s duration
- Paused – Records how much time was paused ( for breaks, etc )
- Distance – Shows the total distance paddled along with any set markers
- Avg Speed – Self explanatory
- Max Speed – Self explanatory
- Location – Determines location of paddle
A detailed description on how to use this app is in one of my previous posts which can be read here…Paddle Logger App Review.
Logging specific paddle data in one place…
Keeping a log of all the paddles from each year helps in planning as well as keeping track of certain statistics such as paddle miles and duration. For this I use Apple’s spreadsheet app Numbers. Like Microsoft’s Excel, Numbers is perfect for logging all the paddles and creating pages in the spreadsheet for each year. Below is an actual spreadsheet that I use to keep track of each paddle, year by year. I personally like to keep track of my paddle locations, total miles paddled for the year, average miles per paddle and my average paddle speed.
Here is how I set up Numbers to log and calculate the information I need…
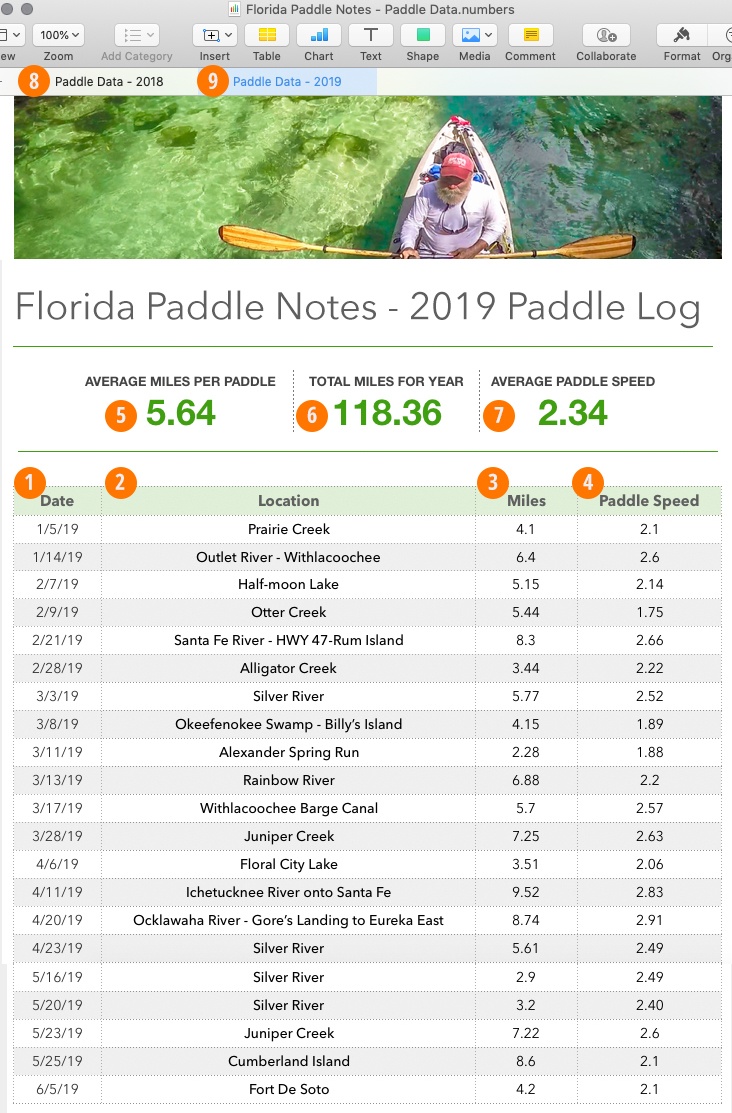 Looking at the spreadsheet to the left, there are 9 areas I will cover on how to set this up. At top, there is an image box that contains the Florida Paddle Notes header. Below that is a text box with a heading of what the spreadsheet covers, here, ‘Florida Paddle Notes – 2019 Paddle Log’. Next is a small table with three columns and two rows, followed by another table with four columns and unlimited rows.
I’ll start with the lower table, as this is where all the data is entered…
- 1. Column A – Date Cell – Date of each paddle
- 2. Column B – Text Cell – Location of each paddle
- 3. Column C – Number Cell – Miles – Total miles for each paddle
- 4. Column D – Number Cell – Paddle Speed for each paddle
All this information comes from the Paddle Logger app. above and entered manually into the spreadsheet. Of course, any app that you prefer can be used to record your paddle data.
Above that table is the smaller three column, two row table that contains the results from the data calculated from the lower table. There are two rows in this table, one for the heading and the second for the formula…
Average Miles per Paddle (5)…

- Column A, Row 1 – A simple Text Cell – Average Miles Per Paddle
- Column A, Row 2 – This is a Formula Cell that displays the average miles paddled per trip, from the lower table Column C. To set this up, do the following…
- Click the cell ( Column A, Row 2 ) where you want the result to appear, then type the equal sign (=)
- When the formula editor opens, begin typing in the word average. Click on the highlighted word average when it appears in the choices, this confirms average in the formula editor.
- Next, move your mouse over the miles heading in the table and the column letters appear above the heading names, click on the column C designation. The column heading Miles now appears in the formula editor.
- With this range now showing up in the formula editor, click the green arrow on the right side of the formula box and this completes the formula. Now every entry in this column gets included in the final calculation.
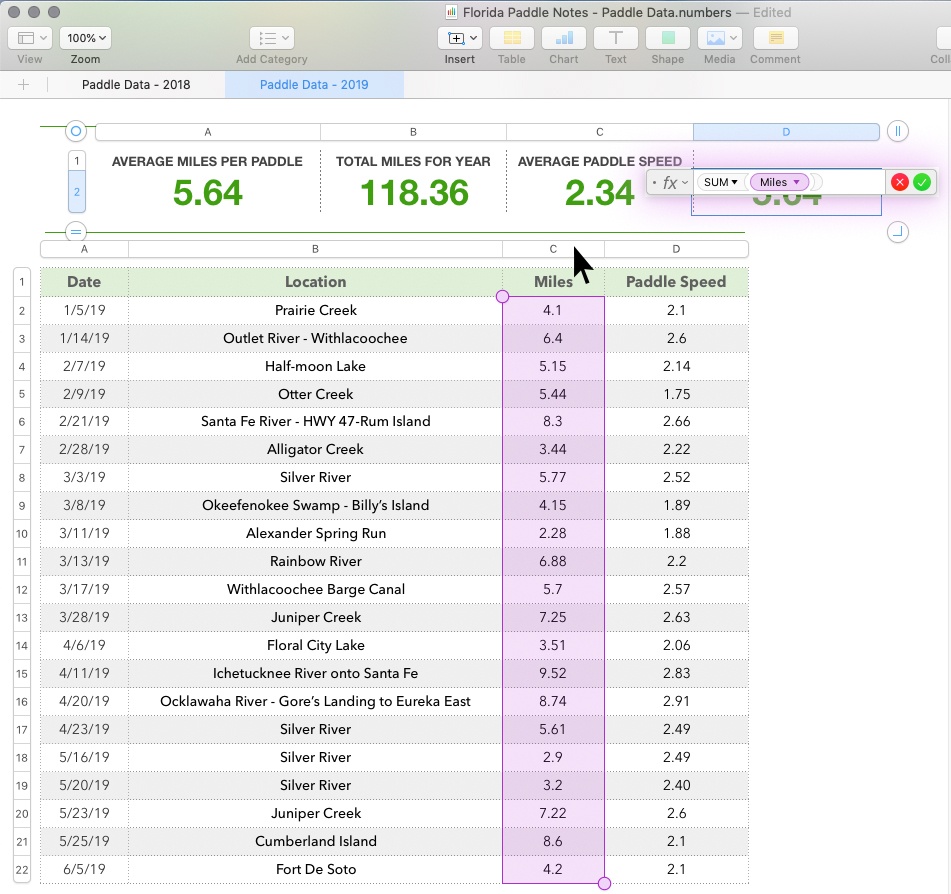
Total Miles per Current Year (6)…
- Column B, Row 1 – A simple Text Cell – Total Miles per Year
- Column B, Row 2 – A Formula Cell that displays the total miles paddled from the lower table Column C. To set this up, do the following…
- Click the cell ( Column B, Row 2 ) where you want the result to appear, then type the equal sign (=)
- When the formula editor opens, begin typing in the word sum. Click on the highlighted word sum when it appears in the choices, this confirms sum in the formula editor.
- Next, move your mouse over the miles heading in the table and the column letters appear above the heading names, click on the column C designation. The column heading Miles now appears in the formula editor.
- With this range now showing up in the formula editor, click the green arrow on the right side of the formula box and this completes the formula. Now every entry in this column gets included in the final calculation. This gives a continual sum of the total miles paddled to date.
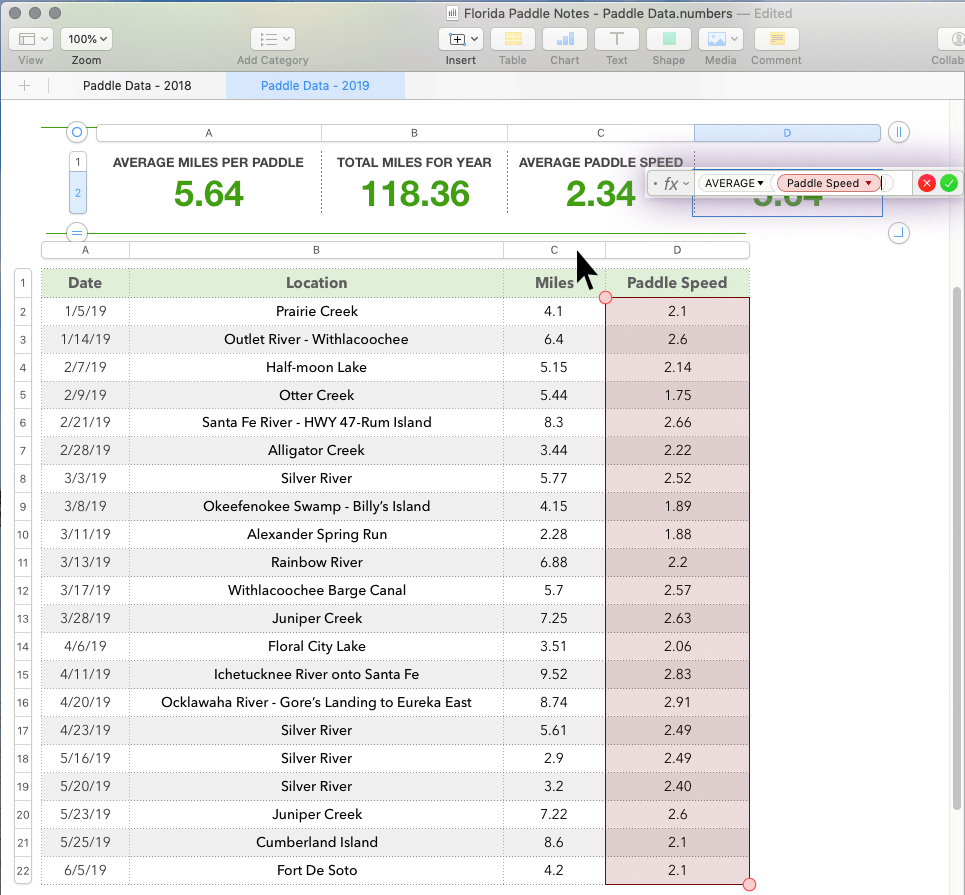
Average Paddle Speed (7)…
- Column C, Row 1 – A simple Text Cell – Average Speed Per Paddle
- Column C, Row 2 – A Formula Cell that displays the average paddle speed from the lower table Column D. To set this up, do the following…
- Click the cell ( Column C, Row 2 ) where you want the result to appear, then type the equal sign (=)
- When the formula editor opens, begin typing in the word average. Click on the highlighted word average when it appears in the choices, this confirms average in the formula editor.
- Next, move your mouse over the miles heading in the table and the column letters appear above the heading names, click on the column C designation. The column heading Paddle Speed now appears in the formula editor.
- With this range now showing up in the formula editor, click the green arrow on the right side of the formula box and this completes the formula. Now every entry in this column gets included in the final calculation. This gives the average paddle speed of all trips to date.
![]()